Data Visualization with R and SUL data
plot
plot(cars)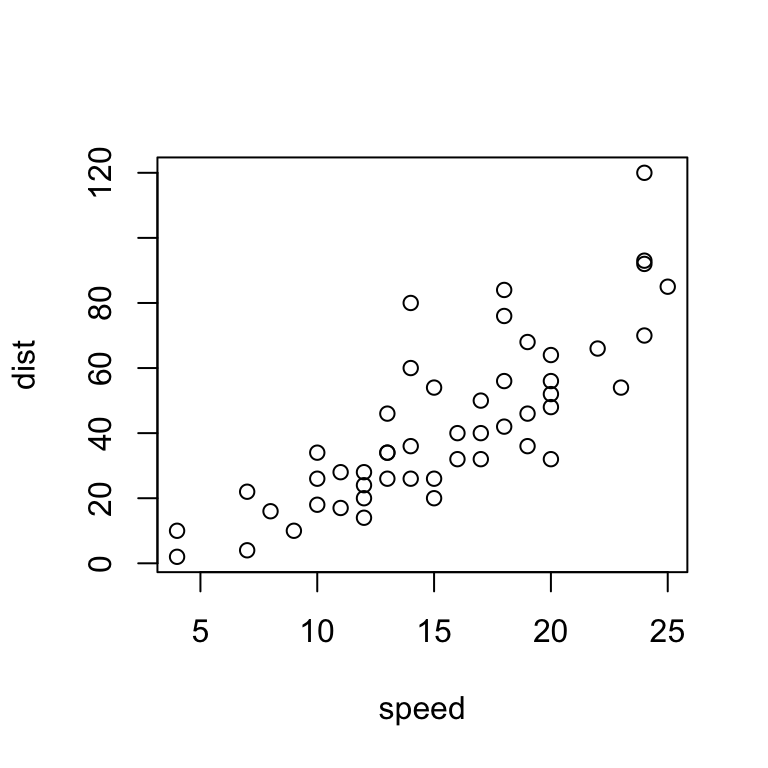
ggplot2
library(ggplot2)
ggplot(cars, aes(speed, dist)) + geom_point()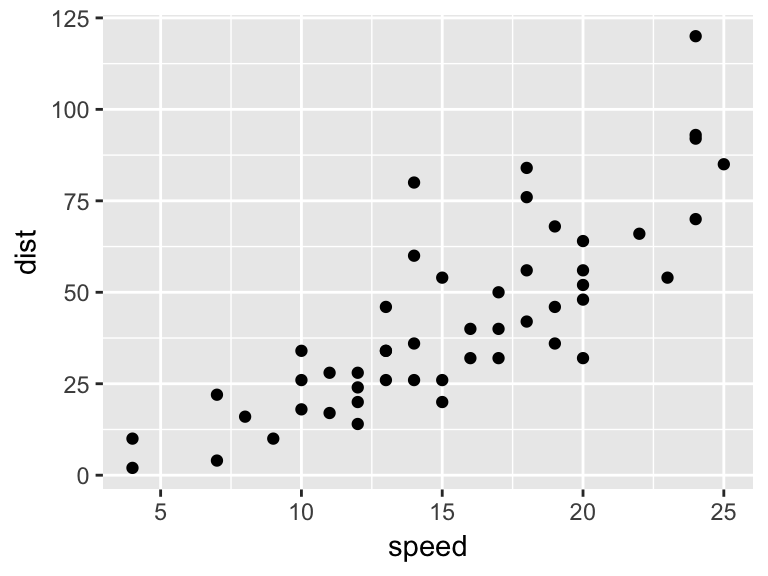
The second (2016) edition of the book is here!
ggthemes
library(ggthemes)
ggplot(cars, aes(speed, dist)) + geom_point() + geom_rangeframe() + theme_tufte()
ggiraph
library(ggiraph)
p <- ggplot(cars, aes(speed, dist, tooltip = speed/dist)) + geom_point_interactive()
ggiraph(code = {print(p)}, height_svg = 4)plotly, using plot_ly function
library(plotly)
plot_ly(cars, x = speed, y = dist, mode = "markers")
plotly, using ggplotly function
p <- ggplot(cars, aes(speed, dist)) + geom_point()
ggplotly(p)
shiny
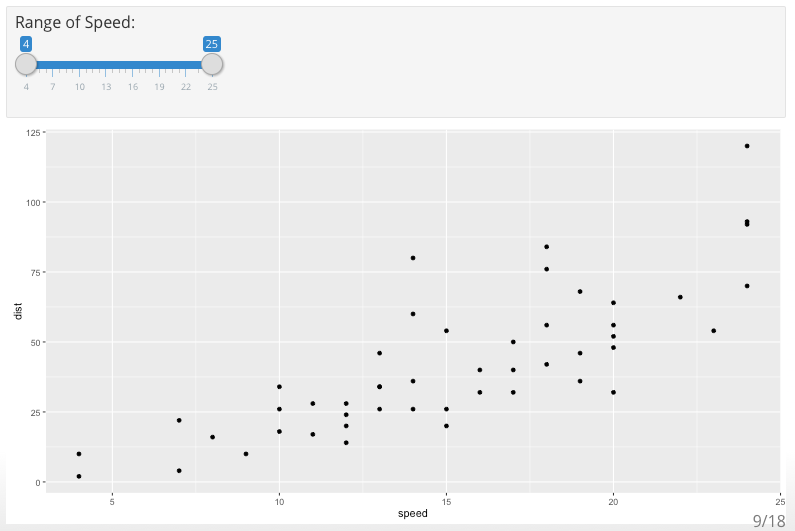
shiny
inputPanel(
 sliderInput("speed_range", label = "Range of Speed:",
          min = min(cars$speed), max = max(cars$speed),
          value = range(cars$speed))
)

renderPlot({
  cars_subs <- subset(cars, speed >= input$speed_range[1] &
                        speed < input$speed_range[2])

  ggplot(cars_subs, aes(speed, dist)) + geom_point()
})
r-esources @ stanford
- r.stanford.edu
- r-stanford mailing list
- R Open Lab Wedsdays 3-5pm – HERE!